
Market Intelligence Briefing
Your competitors read last quarter's map. You're about to read tomorrow's.
The same institutional signals top hedge funds use. Translated into plain English. Delivered 60 to 120 days before the competition sees the turn.
Now Available for Small Business
NewCMT-trained market timing. Wired into Claude.
The same Elliott Wave forward read used by mid-market operators is now embedded in the Claude for Small Business Revenue Readiness Sprint. Wave-position lead triage, buyer-psychology messaging, and capital-cycle attribution. Configured in three weeks from $4,995.
The Problem No One Says Out Loud
Your boardroom is looking at the same rearview mirror.
Pipeline dashboards. Win/loss reports. Last quarter's CAC. Then forward decisions about sectors, geos, and buyers made entirely from what already happened.
The market already moved. The capital already rotated. The buyers who were going to say yes made up their minds weeks ago, on signals that never showed up in your dashboard.
You're not flying blind because you lack data. You're flying blind because every source you rely on is a lagging indicator. That's the problem we built Sophizo to solve.
The Framework
Markets don't move randomly. Neither do your buyers' budgets.
In the 1930s, Ralph Nelson Elliott observed markets move in five waves up, three in correction. Banks adopted it. Hedge funds built systems on it. We apply it to the capital cycles driving your category.
Two Signals · One Read
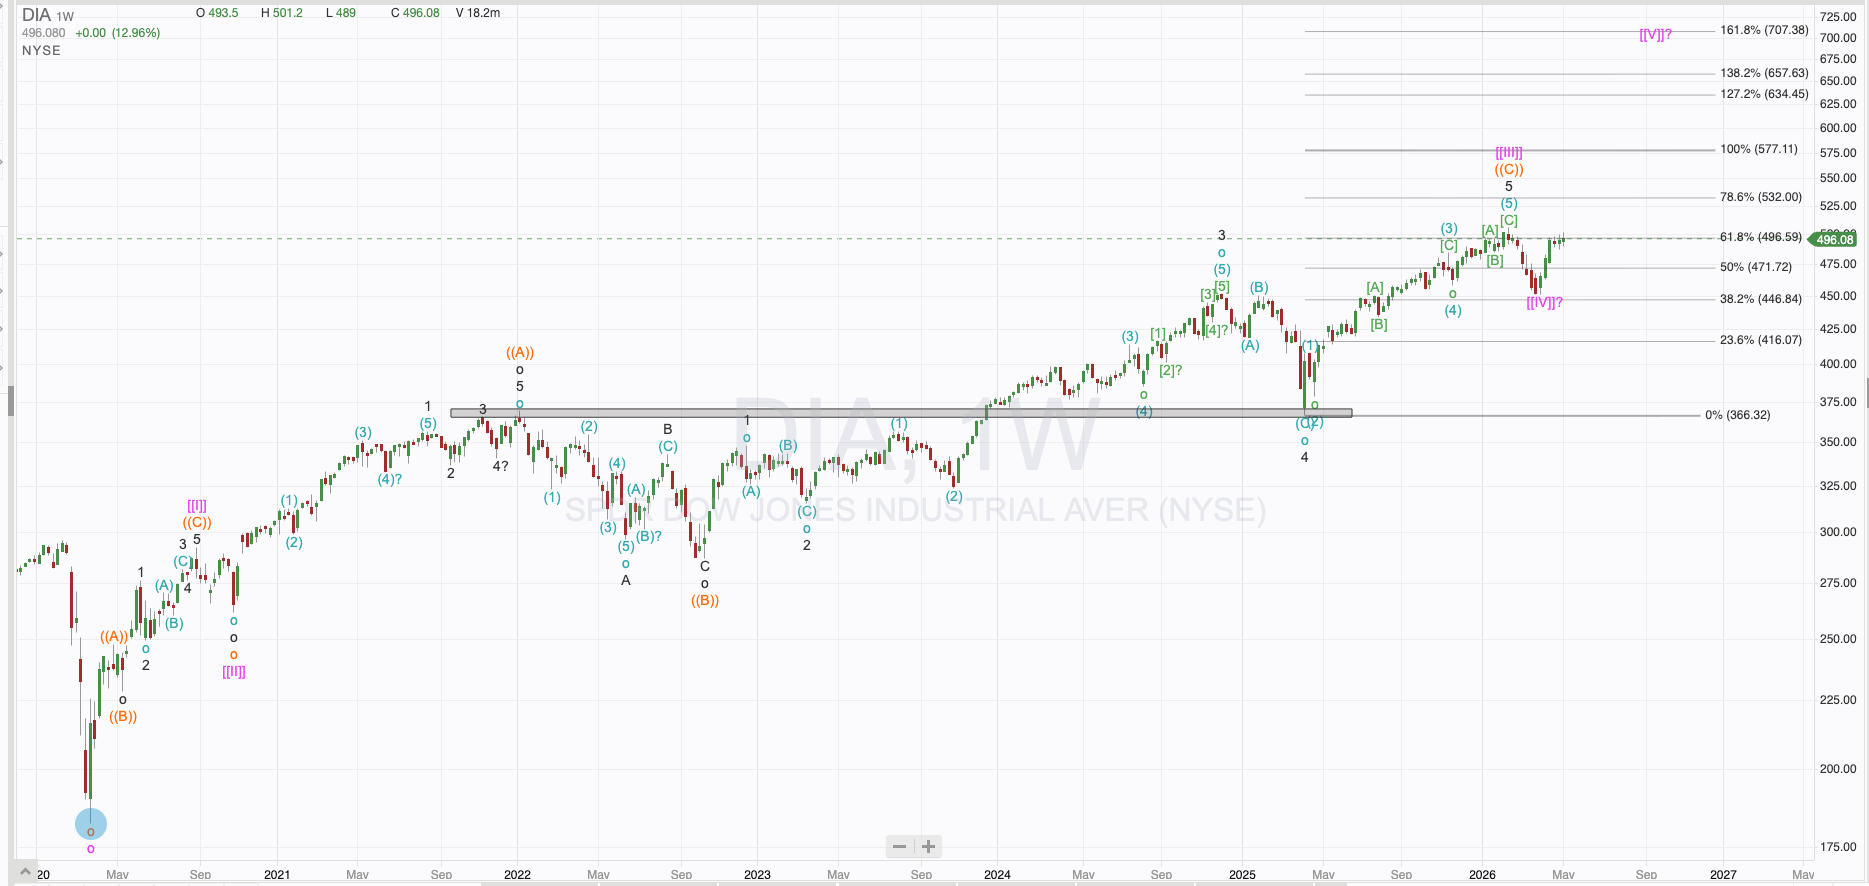
A live wave count on the Dow. The same five-wave structure shows up in the capital cycles driving your category, your sectors, and your buyer segments.
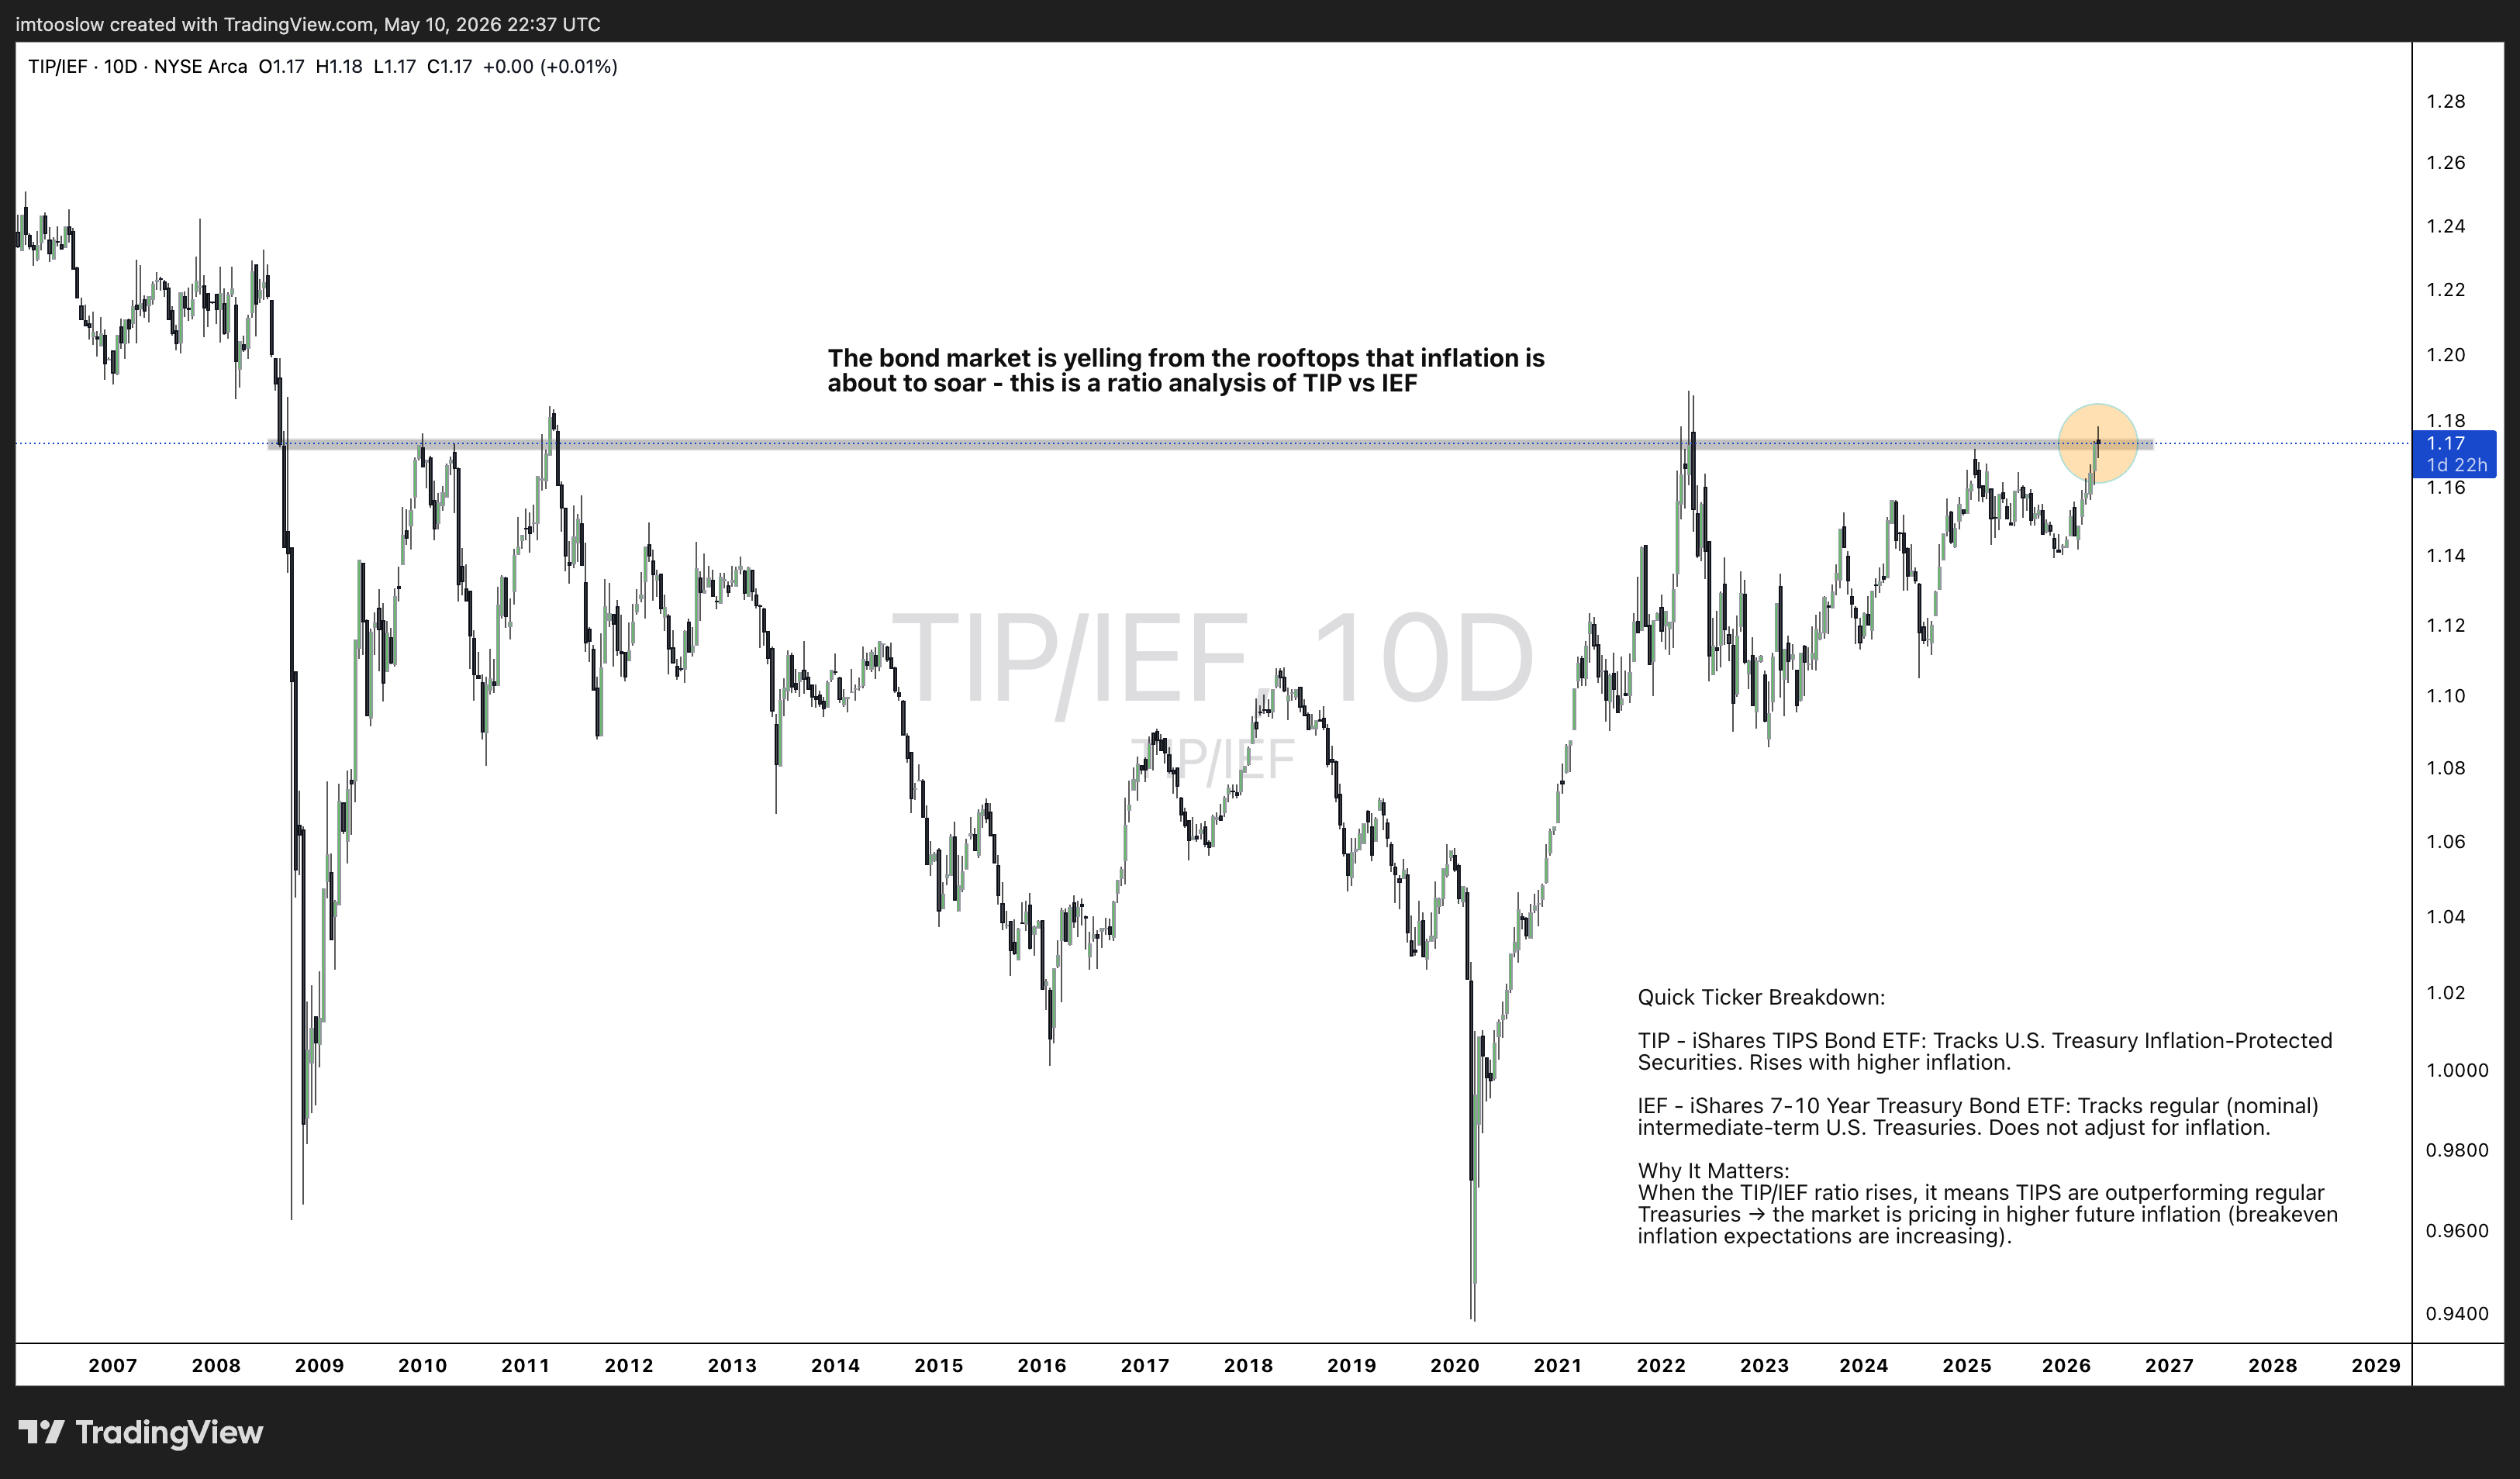
The TIP/IEF ratio breaking above 1.17 means bond traders are pricing in higher inflation. That hits your buyers' budgets one to two quarters before it shows up in any analyst report.
The Read
Equities are extended. Inflation is breaking out. Translated to your business: pricing power compresses, deal cycles lengthen, and the buyers who said yes last quarter will hesitate in the next one. We tell you which of your sectors, geos, and accounts are most exposed before the slowdown lands.
Wave 1
Invisible Opportunity
Trend begins. Press silent. Competitors absent. Capital flowing in quietly. Lowest CAC of the cycle.
Wave 2
Doubt Shakeout
Pullback. Confidence wavers. Sideline watchers feel vindicated. The trend is fully intact.
Wave 3
Everyone Shows Up
Longest, strongest move. Press discovers the trend. Your board asks why you aren't further in. Most operators enter here.
Wave 4
Confusing Middle
Consolidation. Win rates choppy. Trend intact, energy sideways. Easy to misread as stagnation.
Wave 5
Last Dance
Final push. Sentiment peak. Risk of reversal highest. Wave 1 entrants are quietly rotating out.
The edge: we tell you which wave your sector, geography, or buyer segment is in before you commit budget, headcount, or market entry.
The Framework Applied
The right move at the wrong wave is still the wrong move.
Three places we apply the wave read to the highest-stakes bets your team is placing this quarter.
Sector Entry Timing
Before you green-light a vertical, we tell you whether you're entering at Wave 1 (low CAC, thin competition) or Wave 5 (peak CAC, imminent correction). Entry point determines win rate and payback period more than almost any other variable.
Sample question
"Healthcare tech tailwind vs. martech contraction. Where do we put Q2 budget?"
Geographic Expansion
Every region runs its own capital cycle. APAC isn't EMEA. Brazil isn't Singapore. We map the wave position of each target geography before you sign the lease or hire the country manager.
Sample question
"Should we stand up Singapore in Q2, or wait for Brazil to bottom?"
Corrective Wave Navigation
The most expensive mistake is abandoning a correct thesis during a Wave 2 or Wave 4 correction. We separate a healthy pause from a structural break. You hold when the thesis is right. You exit when the structure breaks.
Sample question
"Reallocate Q2 outbound away from regional banks toward industrial AI buyers."
The CMT Advantage
Buyer psychology changes at every wave. Your messaging should too.
Most teams build personas. We build wave-position messaging that meets buyers in the psychological reality of the market they're actually in.
Cost of waiting. First-mover window. Urgency without hype. Edge without noise.
Lead with momentum. Who else is moving. Highest-velocity buying environment. ABM accelerates fastest.
Durability, integration depth, long-term defensibility. Not get-in-before-it's-over. Protect for three years out.
Skip aggressive net-new. Deepen installed base. Demonstrate ROI. Build penetration that sets up the next Wave 3.
The Through-Line
Capital moves. Sectors move. Budgets move. Buyers say yes. Most operators only see the last step.
STEP 01
Capital rotates in
Quiet. No press. Shows up in price action and wave structure.
STEP 02
Sector momentum builds
Six to eight weeks later. Leaders perform. Hiring picks up.
STEP 03
Budgets expand
Four to six weeks more. CFOs release budget. Procurement shortens.
STEP 04
Buyers say yes
Pipeline converts. Press discovers the trend. Most operators see only this step.
The Sophizo read: we sit at the beginning of that sequence. You stop reacting and start positioning ahead of it.
The Trading Desk Mindset
We score your pipeline like a market.
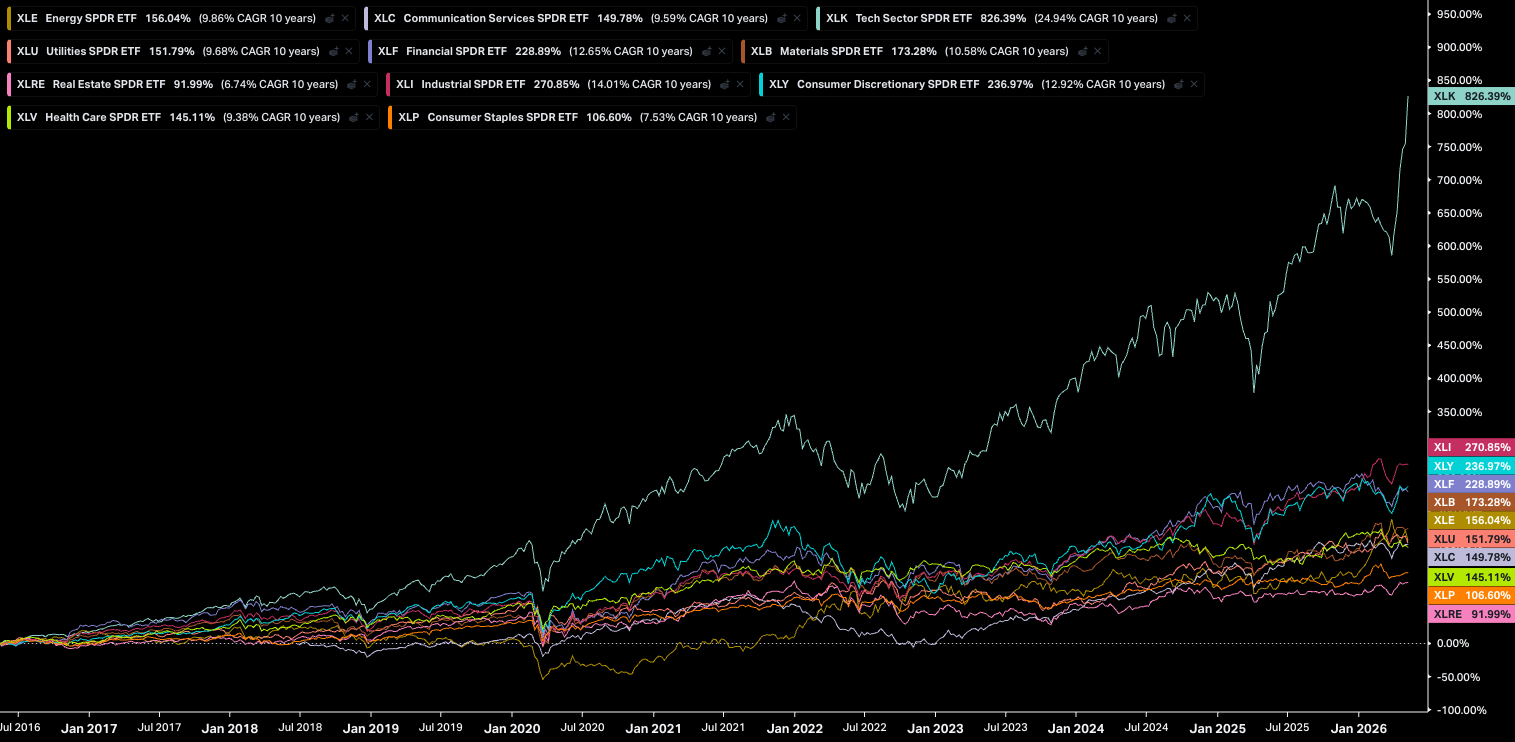
Ten years of sector divergence. Tech runs 826% while Real Estate sits at 92%. The same divergence shows up in your pipeline 45 to 60 days before bookings move.
Two-quarter forward visibility
Most CEOs walk into board meetings with the current quarter and a hopeful gut check on the next one. You walk in with a structurally-derived read on the current quarter plus two out.
14,000+
Hours of Study
SEC
Approved System
2 Qtrs
Forward Read
A Category Of One
Strategy firms tell you what happened. Tools tell you who clicked. We tell you what's coming.
Strategy Firms
(The boutiques and big names)
- Backwards-looking benchmarks
- Six-month engagements
- $500K+ before a recommendation
- No technical-analysis training
Marketing Analytics Tools
(6sense, ZoomInfo, Gong)
- Engagement and intent signals
- Account-level scoring
- Zero macro or capital context
- Tells you who. Never when.
Sophizo Market Intelligence
(What no one else does)
- Elliott Wave on your category and geos
- Capital flow translated for operators
- CMT messaging by wave position
- Forward read 60 to 120 days ahead
The Deliverable
Four modules. One brief. One quarter ahead.
Plain-English narrative. Board-ready format. No dashboard. No charts to interpret.
MODULE 01
Quarterly Category Cycle Brief
- Where your category sits in its wave structure
- 90-day forward read on what's likely next
- Trend-reversal warnings before earnings calls
MODULE 02
Capital & Buyer Flow Intelligence
- Which sectors institutional money is rotating in or out of
- What that means for your buyers' budgets next two quarters
- Pricing power signals: expansion or discount discipline
MODULE 03
CMT-Driven Messaging Intelligence
- Wave-position frameworks for net-new campaigns
- ABM messaging architecture by installed-base cohort
- Updated quarterly as wave positions evolve
MODULE 04
Board-Ready Executive Summary
- One page sized for the board pre-read
- Wave position, capital read, recommended move
- Drops directly into your QBR or board deck
Who This Is For
Multi-million-dollar bets need more than a hunch.
You're a fit if
- $5M to $100M ARR B2B company
- CEO, CFO, or CMO making quarterly bets on sectors, geos, or buyer segments
- Evaluating a new vertical, geography, or market entry
- ABM into installed base with response rates flattening
- Recent missed quarter without a clean explanation
Not for you if
- You want a SaaS dashboard with account-level intent scores
- You need engagement metrics by contact and rep
- You're pre-revenue or still validating product-market fit
- You believe all the intelligence you need lives in your CRM
Built On
14,000+ hrs
Market study
SEC-Approved
Trading system
CMT
Chartered Market Technician
Fractional AI / RevOps
Operator background
Common Questions
Your Next Move
The wave is building. Are you in front of it or behind it?
Complimentary 30-minute Market Orientation. Live wave read on your category. Top capital-flow signals heading into next quarter. Plain-English take on where to focus pipeline, geo, and budget.
No pitch. No deck. Just the read, and what to do about it.
Capital markets move 60 to 120 days ahead of your pipeline. Let's make sure you're in front of it.